How the U.S. and China Helped Contain the Middle East Oil Shock
Coordinated policy moves, resilient supply, and flexible buying strategies by the world’s two largest economies helped keep crude prices in check despite a major regional disruption.
Oil markets absorbed a fresh Middle East supply shock with fewer aftershocks than many feared, as the United States and China moved quickly to stabilize flows and dampen volatility. The actions mattered for the broader market and for stocks linked to energy, transport, and consumer spending, shaping earnings expectations and rate-sensitive trades as investors reassess inflation risks and portfolio positioning across sectors and ETFs.
While tensions around a key shipping chokepoint threatened to squeeze supply, both governments leveraged production strength, inventories, and procurement strategies to cushion the blow. The result: price spikes were shorter-lived, and implied volatility retreated from initial highs, helping the economy sidestep a sharper inflation impulse that could have complicated central-bank policy and investing decisions across global markets, including crypto’s macro-sensitive segments.
What changed vs prior baseline
- Stronger non-OPEC supply cushion: U.S. crude production has hovered above 13 million barrels per day, a record plateau that helped offset shortfalls and maintain export flows. This scale matters because each 1 million bpd of reliable supply can shave several dollars from risk premia embedded in crude benchmarks.
- Procurement flexibility in Asia: China leaned on diversified sourcing and timing of purchases, tapping state and commercial stocks and redirecting cargoes toward non-chokepoint routes where possible. With China’s crude imports averaging over 11 million bpd in recent years, even modest shifts in buying patterns can meaningfully ease prompt-market tightness.
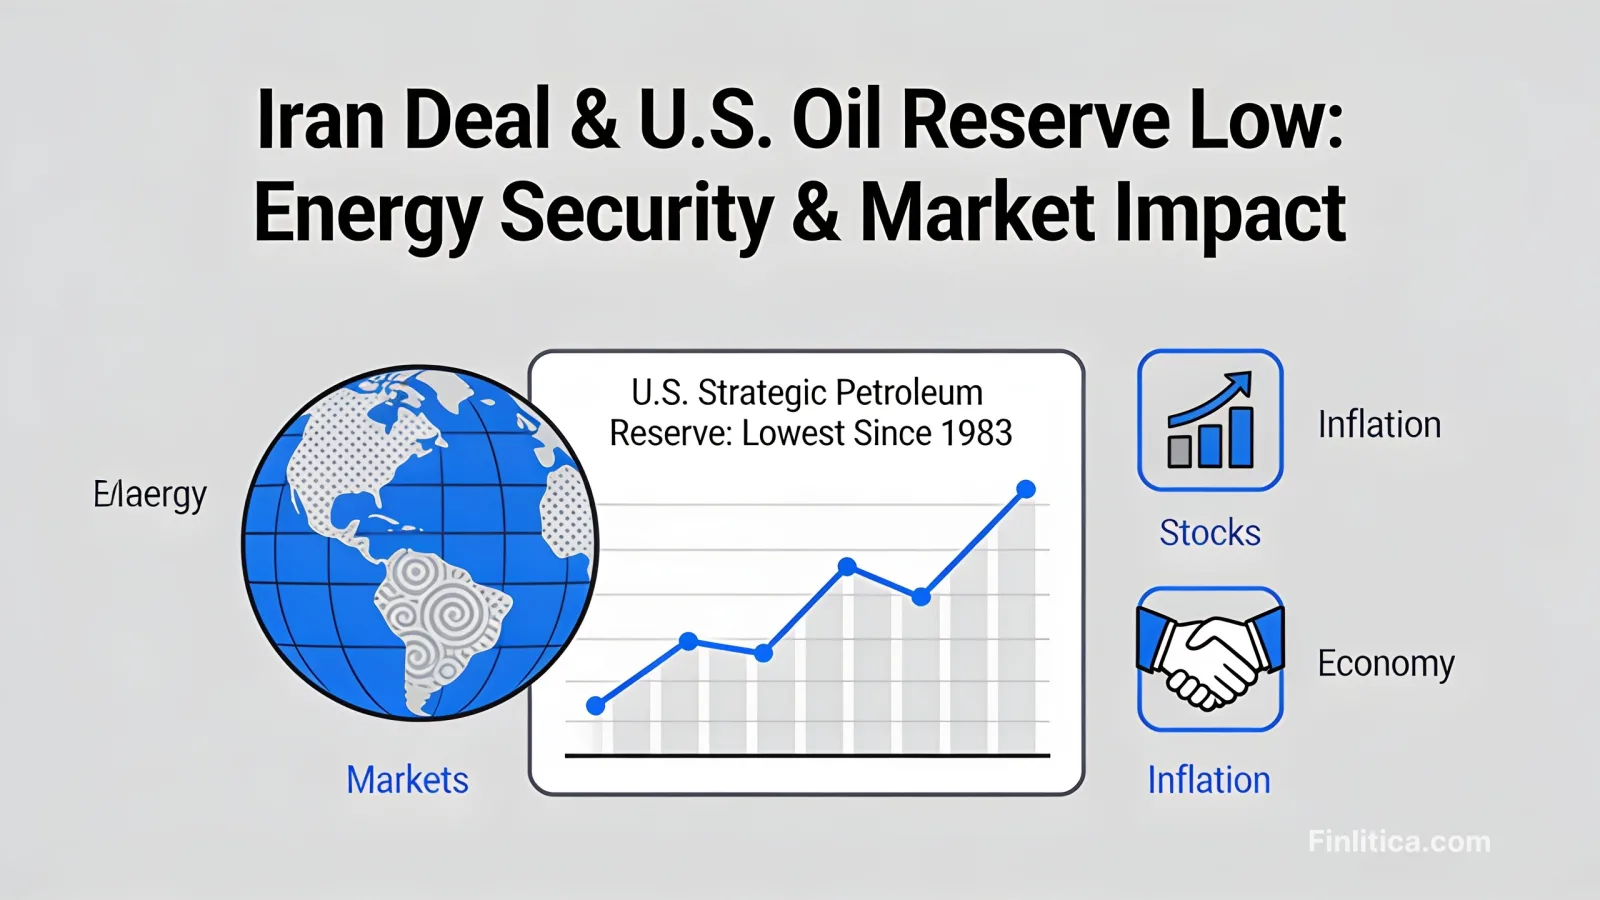
- Inventory management as shock absorber: The U.S. signaled willingness to modulate Strategic Petroleum Reserve (SPR) operations and product reserves to smooth dislocations. When inventories backstop supply, spot-to-futures spreads tend to normalize faster, limiting pass-through to retail fuel prices.
- Maritime flow resilience: The Strait of Hormuz carries roughly one-fifth of globally traded petroleum liquids-on the order of 20 million bpd-yet rerouting, insurance facilitation, and coordinated risk management helped keep a larger share of cargoes moving than worst-case models implied.
State of play
Initial fears that a chokepoint disruption would trigger a prolonged crude surge faded as cargo data showed continued liftings and replacement barrels entering the market. Brent and WTI saw sharp intraday swings, but backwardation narrowed as supply-demand balances improved and refiners adapted crude slates.
Two numeric anchors illustrate the shock absorbers at work. First, U.S. output above 13 million bpd adds a sizable buffer versus prior cycles when domestic supply was several million barrels lower, meaning fewer urgent draws on global inventories. Second, Hormuz’s ~20 million bpd throughput clarifies why even incremental preservation of traffic can avert double-digit dollar gains in crude benchmarks.
Why it matters
- Inflation and rates: Energy is a visible input into CPI. Containing oil prices reduces the risk of a renewed inflation upswing that could delay or reverse rate-cut timelines, stabilizing discount-rate assumptions across equities and credit.
- Earnings visibility: Transportation, chemicals, airlines, and consumer sectors gain planning clarity when fuel volatility subsides, improving earnings quality and guidance.
- Portfolio construction: Lower tail risks enable more balanced allocation across cyclicals and defensives, with less need for expensive hedges.
Market implications
Equities and sector allocation
- Energy producers: Moderated crude reduces windfall pricing but supports steady free cash flow when supply is reliable. Capital discipline and buybacks remain in focus over volume growth.
- Refining and chemicals: Easing crude premiums and stable product cracks can bolster margins. Transport costs and feedstock consistency are positive for integrated petrochemicals.
- Consumer and transport: Airlines, logistics, and retailers benefit from less volatile fuel bills, improving operating leverage and earnings predictability.
Credit and ETFs
- Credit spreads: Reduced macro-energy shock risk steadies high-yield energy spreads and supports refinancing windows for mid-cap E&Ps and service firms.
- ETFs: Broad market ETFs gain from lower inflation uncertainty, while energy-focused funds may trade more on company execution than headline oil spikes. Factor products tilted to value/cyclicals could see steadier inflows if rate volatility cools.
Policy and strategy signals
- U.S. policy toolkit: Messaging around SPR flexibility and refined product reserves acts as a circuit breaker for panic buying. Even without large, immediate releases, credible optionality narrows risk premia.
- China’s demand management: Staggered tenders, diversified suppliers, and drawdowns from state-held stocks reduce spot market stress. With imports north of 11 million bpd, incremental shifts in cadence materially influence prompt spreads.
- Global spare capacity: OPEC+ spare capacity, widely estimated around 4–5 million bpd, remains a latent stabilizer. Its existence tempers the upper tail of price scenarios even if not immediately deployed.
Risks and alternative scenario
- Chokepoint escalation: A sustained or deeper disruption through Hormuz-handling ~20 million bpd-could overwhelm rerouting options, steepen backwardation, and reaccelerate inflation.
- Policy missteps: Premature SPR draws or poorly timed refills could amplify volatility. Likewise, abrupt changes in Chinese buying patterns might tighten the prompt market.
- Supply outages elsewhere: Unplanned maintenance, weather, or geopolitical events outside the Middle East could coincide with regional stress, removing the current cushion.
- Demand surprise: A stronger-than-expected global rebound could lift oil demand above recent peaks near 102 million bpd, tightening balances faster than spare capacity can offset.
What investors are watching
- Inventory trends: OECD and major Asian stock levels indicate whether refiners are leaning on storage or bidding up prompt barrels.
- Freight and insurance: Tanker rates and war-risk premiums are real-time gauges of maritime friction and effective capacity.
- Crack spreads and margins: Product-market signals often front-run changes in crude benchmarks and feed into earnings revisions.
FAQ
How did the U.S. limit the price impact?
Record-high domestic production, export flexibility, and clear communication about SPR optionality signaled supply support. Together, these reduced risk premia and curbed panic buying in futures and physical markets.
What role did China play?
China adjusted the timing and mix of crude purchases, drew on inventories, and diversified sourcing. Because it imports over 11 million bpd, even small changes in buying cadence can ease tightness in the prompt market.
Why is the Strait of Hormuz so important?
It carries around one-fifth of globally traded oil-roughly 20 million bpd-so any prolonged disruption can significantly lift prices and volatility. Maintaining flows prevents outsized shocks to inflation and growth.
Could prices still surge?
Yes. A deeper, sustained disruption, compounded by outages elsewhere or a stronger-than-expected demand rebound toward 102 million bpd, could tighten balances and reignite inflation concerns.
What should diversified investors monitor now?
Track inventories, shipping costs, and product cracks, alongside inflation prints and rate expectations, to gauge second-order effects on equities, credit, and ETF positioning.
Sources & Verification
-
View sourceCNBC Top Newswww.cnbc.com