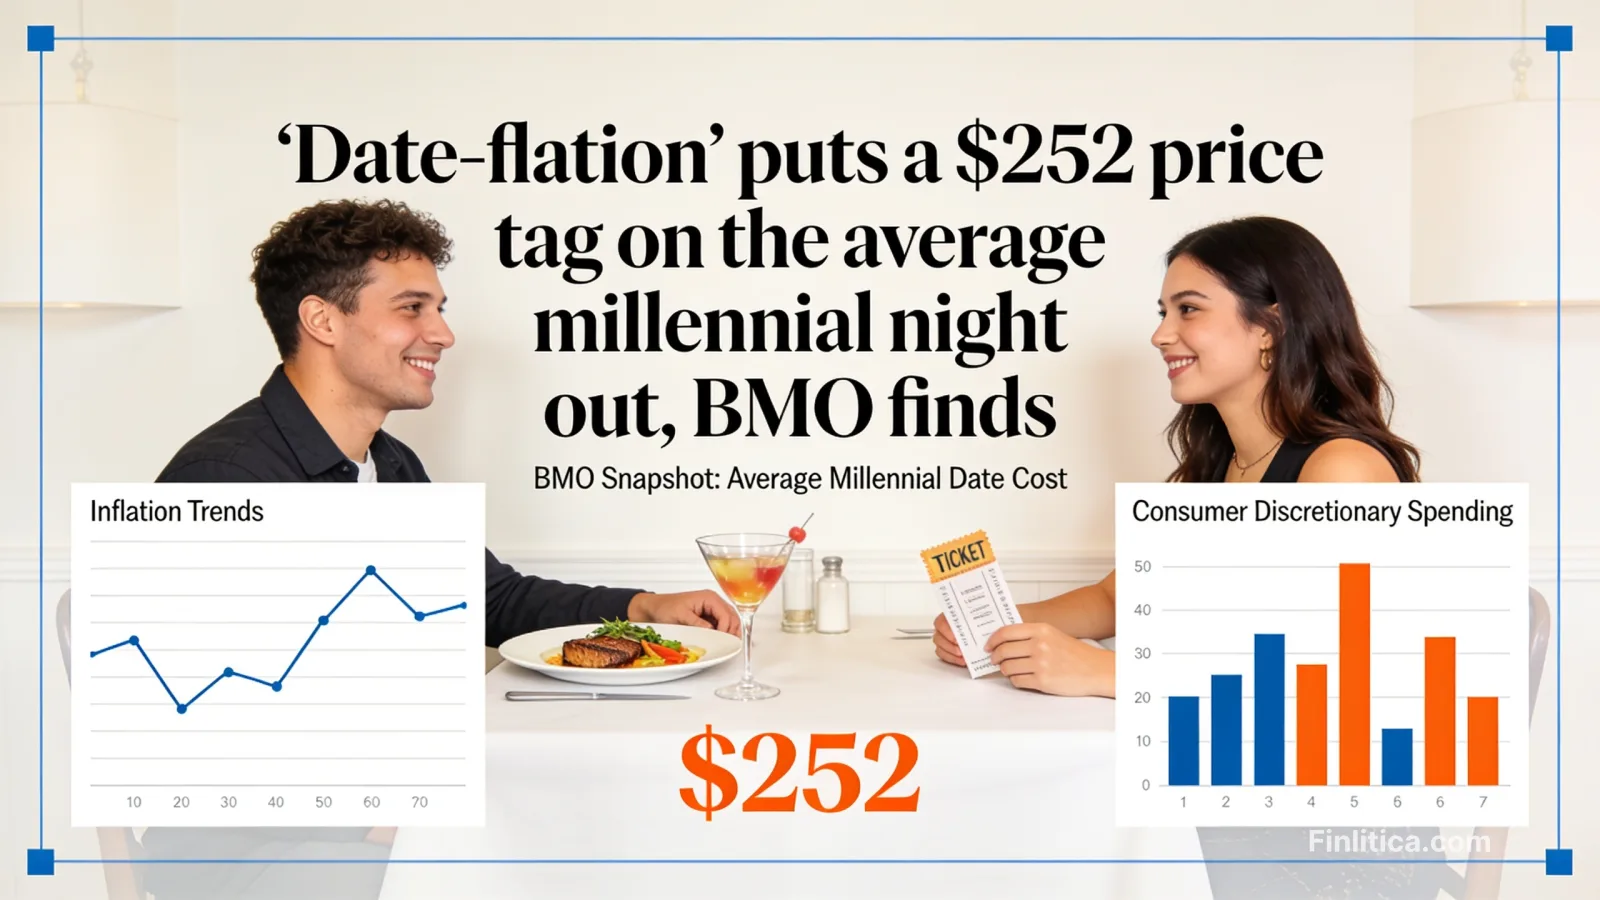
‘Date‑flation’ puts a $252 price tag on the average millennial night out, BMO finds
A new BMO snapshot shows the average millennial date now costs $252, outpacing broader price trends and reshaping spending habits. Here’s what the rise in “date‑flation” means for the economy and investors.
Dating is getting more expensive-and it is starting to show up in household budgets and consumer behavior. A new readout from BMO finds the average millennial date now runs $252, underscoring how lifestyle costs are rising faster than many expected. The surge in so‑called date‑flation has implications for the economy and markets as consumers trim discretionary outlays, trade down, or skip plans altogether.
Why it matters for investors: shifts in small, high‑frequency purchases often signal broader demand patterns. When a single evening out can top two hundred dollars, the incremental squeeze can ripple across restaurants, transportation, entertainment, and personal care, informing views on inflation, earnings resilience, and sector positioning.
What changed vs prior baseline
- Higher all‑in tabs: BMO’s figure pegs the average millennial date at $252, a level that bundles dining, drinks, transit, entertainment and incidentals. That price point is materially above pre‑pandemic anecdotal norms, indicating stickier services costs.
- Behavioral shift: Consumers report going on fewer dates, choosing cheaper formats, or pausing dating-signs of elasticity as prices climb. This mirrors broader trade‑down patterns in discretionary categories.
- Services inflation bite: The mix of restaurants, bar tabs, rideshare, and tickets concentrates spend in services, where price stickiness has been persistent-keeping perceived inflation higher than goods categories.
- Budget reallocation: Elevated recurring social costs crowd out savings or other purchases, pressuring wallets even when headline inflation stabilizes.
By the numbers
- $252: The average cost of a millennial date cited by BMO. This single data point anchors a meaningful share of monthly discretionary spend for many households.
- 1 night out per week ≈ $1,008/month: At $252 each, four dates in a month cross the $1,000 threshold, rivaling major line items like rent, student loans, or car payments for some consumers.
- Millennials are roughly 30-45 years old in 2026: This cohort spans prime earning and family‑formation years, so spending shifts here can move the needle for services earnings and sector ETFs tilted to consumer discretionary.
What people are cutting-and where dollars still flow
Households are adjusting by swapping prix‑fixe dinners for fast‑casual, movie tickets for streaming at home, and rideshares for public transit or walking. Yet some categories remain comparatively resilient: special‑occasion dining, limited‑time events, and lower‑ticket experiences that deliver strong perceived value. For businesses, the message is clear-value, bundling, and promotions matter more than ever to win repeat visits.
Market implications
Equities
- Restaurants and bars: Full‑service operators may see softer traffic but stronger average checks from special occasions; fast‑casual chains and value concepts could gain share. Watch commentary on mix, promotions, and traffic elasticity in upcoming earnings.
- Entertainment and experiences: Live events and premium experiences can hold up if consumers consolidate spending into fewer, bigger nights. Streaming and at‑home entertainment may benefit from substitution effects.
- Beauty, apparel, and personal care: Pre‑date spending (grooming, cosmetics, outfits) could bifurcate-trade‑down for routine items, with selective splurges on premium or long‑lasting goods.
Credit and consumer balance sheets
- Card spend mix: Higher ticket sizes per outing can lift card volumes even if transaction counts dip. Monitor delinquencies if recurring social spend crowds out essentials.
- Lenders: Subprime borrowers are more exposed to budget strain; prime consumers may simply reallocate spend. Underwriting and credit loss guidance are key swing factors.
ETFs and sector allocation
- Consumer discretionary ETFs: Preference may tilt toward value‑oriented quick‑service names, experiential entertainment, and at‑home alternatives over premium casual concepts with weaker pricing power.
- Staples vs discretionary: If date‑related services stay pricey, staples could modestly outperform on defensiveness, while selective exposure within discretionary targets value leaders.
Why it matters
- High‑frequency signal: A $252 average date highlights persistent services‑side pressure that can inform readings on inflation beyond headline measures.
- Earnings sensitivity: Discretionary categories tied to dining, entertainment, and mobility are directly exposed to changes in frequency and basket size.
- Household welfare: Elevated social costs can squeeze savings rates and delay larger purchases, shaping the near‑term consumption outlook.
Risks and alternative scenario
- Price normalization: Promotional intensity or easing input costs could pull average date prices lower, reviving traffic and diluting the trade‑down narrative.
- Income tailwinds: Wage growth or tax refunds may offset higher services prices, sustaining discretionary spend despite sticker shock.
- Substitution overshoot: If consumers pivot too aggressively to low‑cost alternatives, premium brands could see sharper‑than‑expected volume declines even with discounts.
- Measurement caveats: Averages can mask wide regional and urban‑suburban differences; outliers may skew perceived affordability.
How companies can respond
- Bundle value: Prix‑fixe menus, happy‑hour windows, and experience bundles can defend traffic while protecting margins.
- Loyalty and personalization: Targeted offers tied to occasion‑based visits can convert infrequent outings into repeat business.
- Cost transparency: Clear pricing and reduced surprise fees (service charges, venue surcharges) help preserve trust and repeat visits.
FAQ
What does the $252 include?
The figure reflects an average all‑in date cost for millennials, commonly spanning dining, drinks, transportation, entertainment, and incidental fees. Actual spend varies by city, venue, and occasion.
Who is counted as a millennial?
Millennials are generally those born between 1981 and 1996, which places the cohort at roughly 30-45 years old in 2026.
How often do people go on dates, and what does that mean for budgets?
Frequency is highly variable. At the cited average, one date per week could total about $1,008 per month, a material slice of discretionary income for many households.
Is this inflationary for the broader economy?
The data points to stickiness in services prices that consumers feel day‑to‑day. While it is one slice of spending, persistent pressure in dining and entertainment can keep perceived inflation elevated even if goods prices ease.
Sources & Verification
-
View sourceCNBC Top Newswww.cnbc.com